DIGIVI

Find any farm in the country, see what it's worth in seconds.

One map of South Africa. Open a farm and you get what it's worth, the sales that prove it, and the satellite evidence behind them — in seconds instead of an afternoon.

Request early access
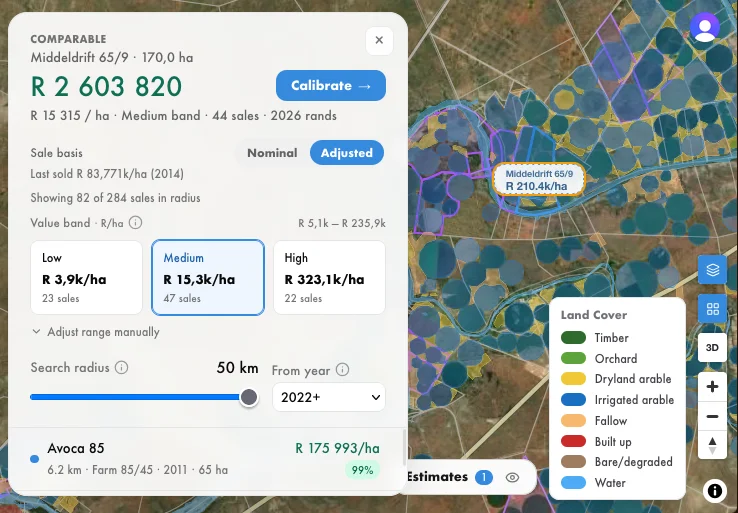
Drop a map screenshot — satellite with cadastral boundaries, one parcel selected
How it works

Digivi never returns one vague price for a whole farm. It decomposes value across land uses,
just like you would.

Built from the land's parts

Each farm is gridded and classified by land use, and each use carries its own value — so irrigated cropland keeps its premium over grazing veld.

Reads land like a valuer

Satellite signatures, climate, soil, terrain, field structure and per-land-use comparable sales — grazing is priced off nearby grazing, not a blended average.

Anchored to real evidence

Per-class values are inferred from thousands of mixed-use farm sales, then anchored to land-price studies and lending-sector price bands.
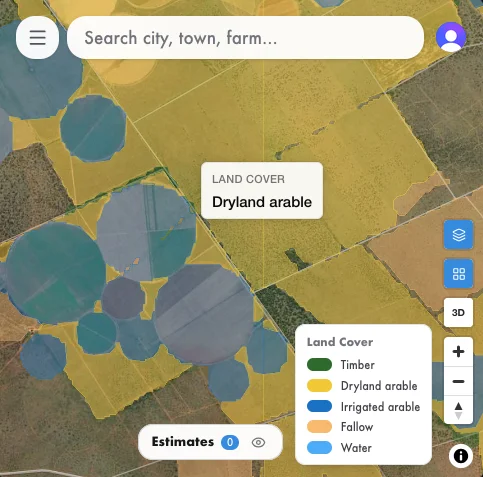
Drop the farm's satellite view — land cover and cadastral outline
Where the value comes from
Dryland · 58% of valueVeld · 41% of valueBuilt-up · under 1%
Coverage decompositionper-land-class estimate · 617,0 ha
CoverageAreaShareModel R/haValue
Dryland200,2 ha35.6%R 15 847R 3 648 664200,2 ha · 35.6% · R 15 847/ha
Veld352,4 ha54.5%R 7 410R 2 611 718352,4 ha · 54.5% · R 7 410/ha
Built-up———R 32 920Built structure · R 32 920
Total617,0 ha100%R 9 727R 6 293 301617,0 ha · 100% · R 9 727/ha blended

Each land class is priced at its own model R/ha and multiplied by measured area. Override any component where you know the land better — your edits are saved with the valuation.

The deliverable

What is in a report?

Not a single automated number. The subject and its agronomy, the comparables you curated, the district market behind them, the whole candidate pool including what you left out, and the basis of value — dated, and openable back on the live map.

Land valuation summaryPortion 0 · 617,0 ha
Mooihoek 1429
Calibrated value
R 6 293 301
R 9.7k/ha blended · calibrated
Dryland (med) · 35.6%R 3 648 664
Veld · 54.5%R 2 611 718
Built-upR 32 920
Property and agronomy617,0 ha measured
Mean annual rainfall515 mm
Soil texture19.3% clay · 68.8% sand
Soil pH6.5-8.3
Nitrogen248.4 mg/kg
Land composition
Veld 47.3%Dryland 35.6%Fallow 7.1%Water 6.5%Timber 3.4%
Selected comparables10 km · from 2022 · low band
FarmDistYearAdj 2026
Mooihoek 1429 subject——R 9 727
GROENEBLOEM 14262.22022R 4 565
Blended selected set——R 4 565
Candidate pool
7 sales within 10 km · grouped by price tier
ComparableDistYearAreaR/ha
Mooihoek 1429 subject——617,09 727
Low · 1 sale · avg R 4 565/ha
GROENEBLOEM 1426 SELECTED2.2202285,74 565
Medium · 5 sales · avg R 15 913/ha
NOOITGEDACHT 3435.42025428,910 070
AARDBOL A 15419.42024622,213 324
AARDBOL 1289.7202439,313 325
JANSEKRAAL 6747.82024284,113 327
FAIRDALE 8878.72022444,527 058
High · 1 sale · avg R 27 062/ha
MERINO 5739.52022301,727 062
REGIONAL MARKET 
Latest median
R 9 210/ha
Subject vs median
+5.6%
Avg sales / year
3
Record spans
2010–2025
Transaction volume · sales per year
'10'16'20 · 11 sales'25
DOING IT THE OLD WAY

Radius searches return hundreds of results. Digivi returns the ones that matter.

Today a valuer phones colleagues or searches internal records to find recent sales of similar farms. A radius search comes back with hundreds of lines and no similarity ranking — most of them irrelevant. Here is the same farm, answered both ways.

Cost per analysis · building this by hand
What the analysis needs
EXISTING SERVICES
On Digivi
Comparable local transactions
A typical search in a new region to establish baseline price statistics
R264 
12 titles at R22/title
R18.7
200+ titles per search
Customer facing report
Refined single document report without noise or redundant information
R179
Noisy unstructured report
R112
Detailed R/ha breakdown of farm value
Assembled from land-price studies and your own record of district sales
not sold
R9.3
Estimate with regional value bands
Bulk localised statistics of transaction patterns and changes over time
not sold
R0
Detailed GIS map with Agronomic properties
GIS located land cover, rainfall, property boundaries, soil properties, grazing capacity
not sold
R0
Curating a defensible comparable set
Reading hundreds of unranked lines down to the handful you would stand behind
1 – 3 hours
30 seconds
Writing it up with the evidence attached
Maps, tables, method and the sales you excluded, in your own template
1 – 2 hours
30 seconds
One farm, to the same standard
Estimated time to report
R443
+ 2 – 5 hours
R140
1 Minute
WHO IS IT FOR

Four kinds of question, one evidence base
Famers and Valuers
What they need
How Digivi helps
Agricultural valuators
A defensible farm value, plus the comparable sales to justify it in a report
Find the parcel, read its history, pick comparables, save a report-ready valuation
Surveyors & agents
A fast, reliable reference price — especially in unfamiliar farming regions
An instant minimum and expected value to guide pricing and negotiation
Economists & credit assessors
A quick, independent check on what a farm is worth
A coarse valuation in seconds, supplemented by interpretable analytical estimates
Banks, co-ops & municipalities
Consistent, independent agricultural valuations at scale
One engine and one evidence base, applied to any farm in the country
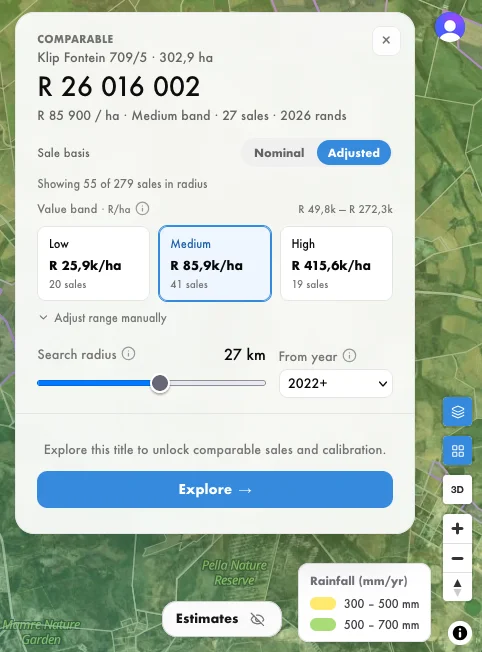
Drop a screenshot of the app in use — parcel selected with the valuation panel open

Pricing

Credits pay for the evidence you reveal, the calibrations you run and the reports you send.

PersonalPay as you go
R950per 500 credits
500 credits · R1.90 each
BusinessSubscription
R2,800/month
R0.93 a credit
EnterpriseSubscription
Let's talk
quoted against your portfolio
Basis
Bought when needed
Monthly
Contracted
Seats
1
3
20 and up
Credits
500, bought as needed
3,000 / month, pooled
40,000+ pooled
Rate per credit in the bundle
R1.90
R0.93
R0.45
Top-up rate, out of bundle
R1.90 same pack rate
R1.47
R0.71
Revealed farms shared across the organisation
single seat
Yes
Yes
SSO, custom roles, API, SLA
—
—
Included

How credits work

The rates the app charges today.

Preview any parcelFree
Explore comparables surrounding a parcel20 credits
Re-open it within 90 daysFree
Refresh after 90 days8 credits
Decompose valuation into land cover valuation10 credits
Generate detailed, calibrated report120 credits
Regenerate with no changeFree

Usage estimator

The same arithmetic the app uses.

Credits
2,000
Best fit
Business
Completed valuations a month8
reveal + calibrate + report · 150 credits each
Extra farms revealed, no report40
the agent pattern · 20 credits each
Personal Plan
R3,800
4 × 500 credits
Business
R2,800
within the bundle

Business works out cheaper here: R2,800 a month against R3,800 on the Personal Plan, with two more seats and reveals shared across the organisation.

Frequently Asked Questions

How do I know the estimate is right?

You don't take it on faith. Every comparable is listed with its price, distance, date and the reason it was selected, and you can remove any you don't accept and recalibrate. Higher-value land uses must outrank lower ones, and the model is tested by holding out whole regions.

My clients need a SACPVP valuation.

Digivi doesn't produce one and doesn't claim to. It produces the evidence base and an indicative estimate — the research step, not the signature.

We already pay for deeds searches.

Digivi isn't a deeds search. It's what you'd build on top of one: the subject, its history, the priced comparables around it and the estimate, in a single click instead of a dozen line charges.

It won't know my district.

Override any component value where you know the land better; your edits are saved with the valuation.

What about water rights?

Not modelled yet, and we say so rather than pretending otherwise. It's a known value driver and it's on the roadmap.

Where does the data come from?

Cadastral titles and recorded deeds, plus Digivi land-cover and agronomy layers where available. Nominal deed prices are shown as recorded; adjusted figures apply a provincial inflation correction to 2026 terms.

Be part of the early access.

Digivi is invite-only, in active use by agricultural valuators, surveyors and land economists on live valuations. If you value, finance or trade South African farmland, help us shape what comes next.

· Bring a farm you already know and check our numbers against yours
· Your organisation's work stays inside your organisation
· Every credit movement is visible to you in Usage
I'm requesting access for

Used only to review your access request. Access is by invitation while we onboard.